.png?width=500&height=500&name=PSYMPL_ICON+SET-04%20(1).png)


Table of contents

.svg)
We are now in 2025 with a full year ahead of us, under a new Administration with a decidedly different approach to the economy. Whether this approach leads to economic growth, short- or longer-term decline, or something in-between is yet to be seen. However, one might anticipate consumer reaction depending on market conditions through past behavioral data and prospective research insights. These data help financial advisors manage client expectations and better target prospects who are looking to invest across varying market conditions.
Risk Tolerance
Psympl is dedicated to uncovering deep consumer insights to inform the strategies and marketing efforts of stakeholders in the financial services and wealth management industries. In late 2024, Psympl partnered with Ipsos, one of the leading market research firms in the world, to conduct a comprehensive, nationally representative survey (n=3,000) of consumers' approaches to investment, money management, and financial advisors. The data can be analyzed across demographic, socioeconomic, and psychographic variables.
One of the topics in this study was risk tolerance. We wanted to understand which consumer types are willing to bear more, or less, financial risk. This may be influenced by personality, but it must also be considered in the context of market conditions. This article will examine different aspects of risk tolerance for a mix of consumer types to compare and contrast.
Study respondents were given a series of attitudinal statements and asked to indicate the extent to which they agreed or disagreed with those statements following a five-point Likert scale (Strongly Agree, Agree, Neither Agree nor Disagree, Disagree, Strongly Disagree). The following charts outline differences among certain demographic and socioeconomic segments, illustrating the percentage of respondents who answered Strongly Agree or Agree to each statement.
Generational Response to Risk Tolerance
|
|
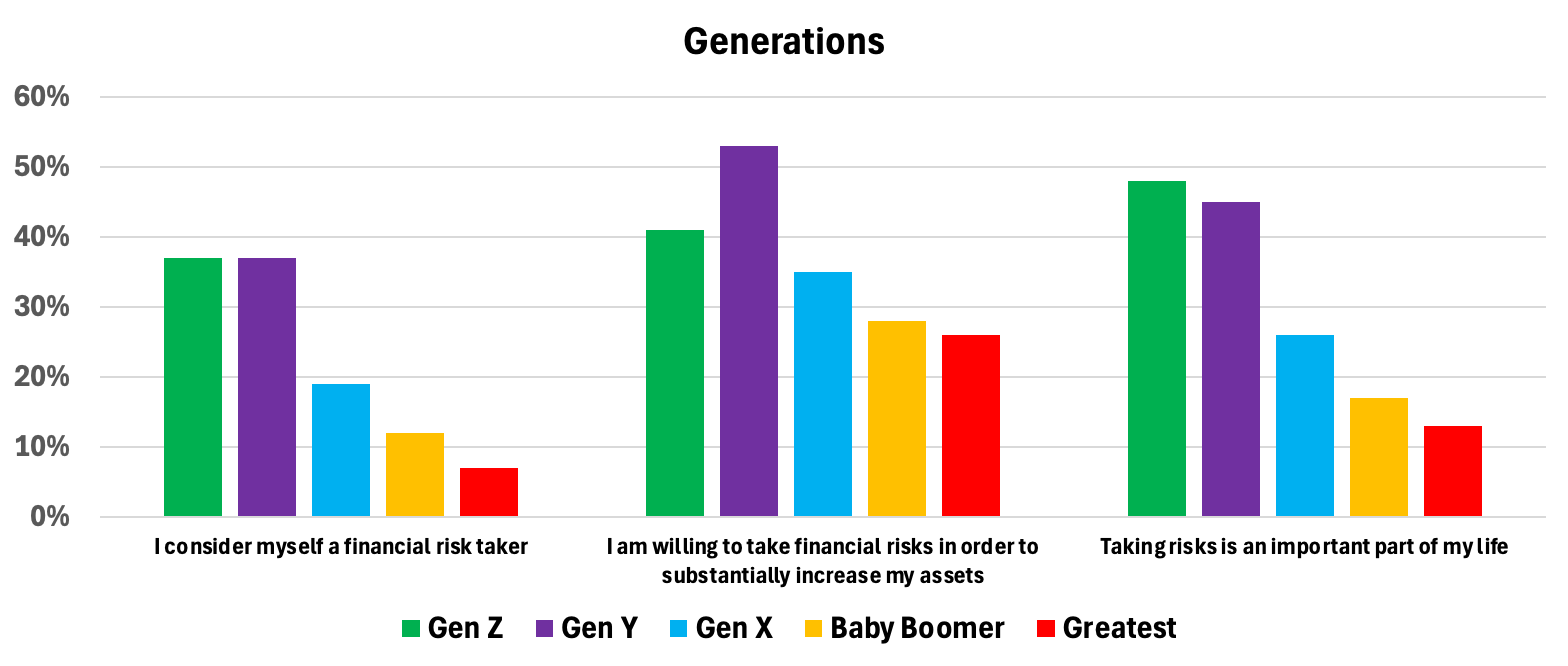
Looking at generational differences, it may be little surprise that younger generations -- Gen Z and Gen Y/Millennials -- are significantly more likely to indicate a willingness to take financial risk. While the majority of these generations do not characterize themselves as risk-takers, a high percentage of Gen Z and Gen Y characterize risk-taking as part of their self-identities. On the other hand, older cohorts like the Boomer and Greatest generations are much less willing to bear financial risk. Given their shorter time horizon, losses are much harder from which to recover.
Gender Response to Risk Tolerance
|
|
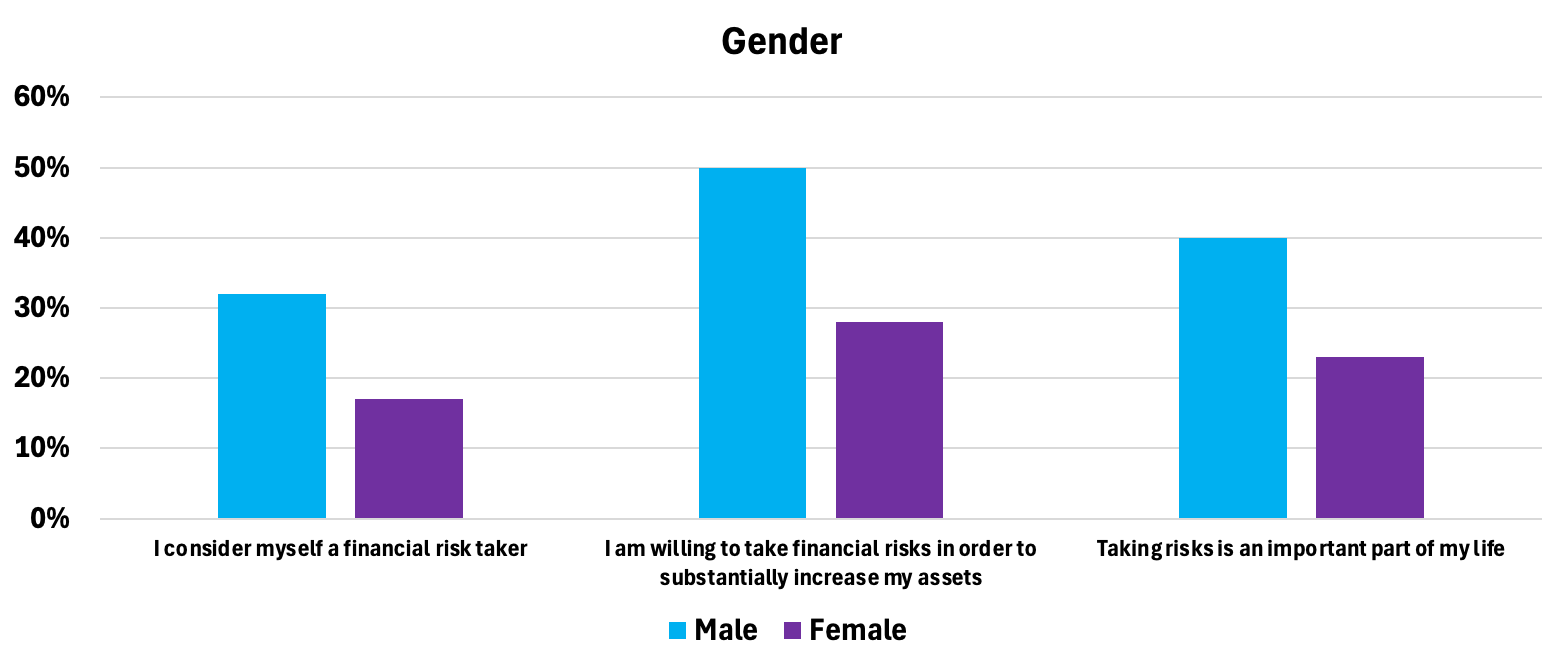
There is also a significant difference between males and females in willingness to accept financial risk. Across all three attitudes expressed in the chart above, males are nearly twice as likely to self-describe as risk-takers. The majority of each gender may not be risk-takers, but males are more likely to bear financial risk.
Education Response to Risk Tolerance
|
|
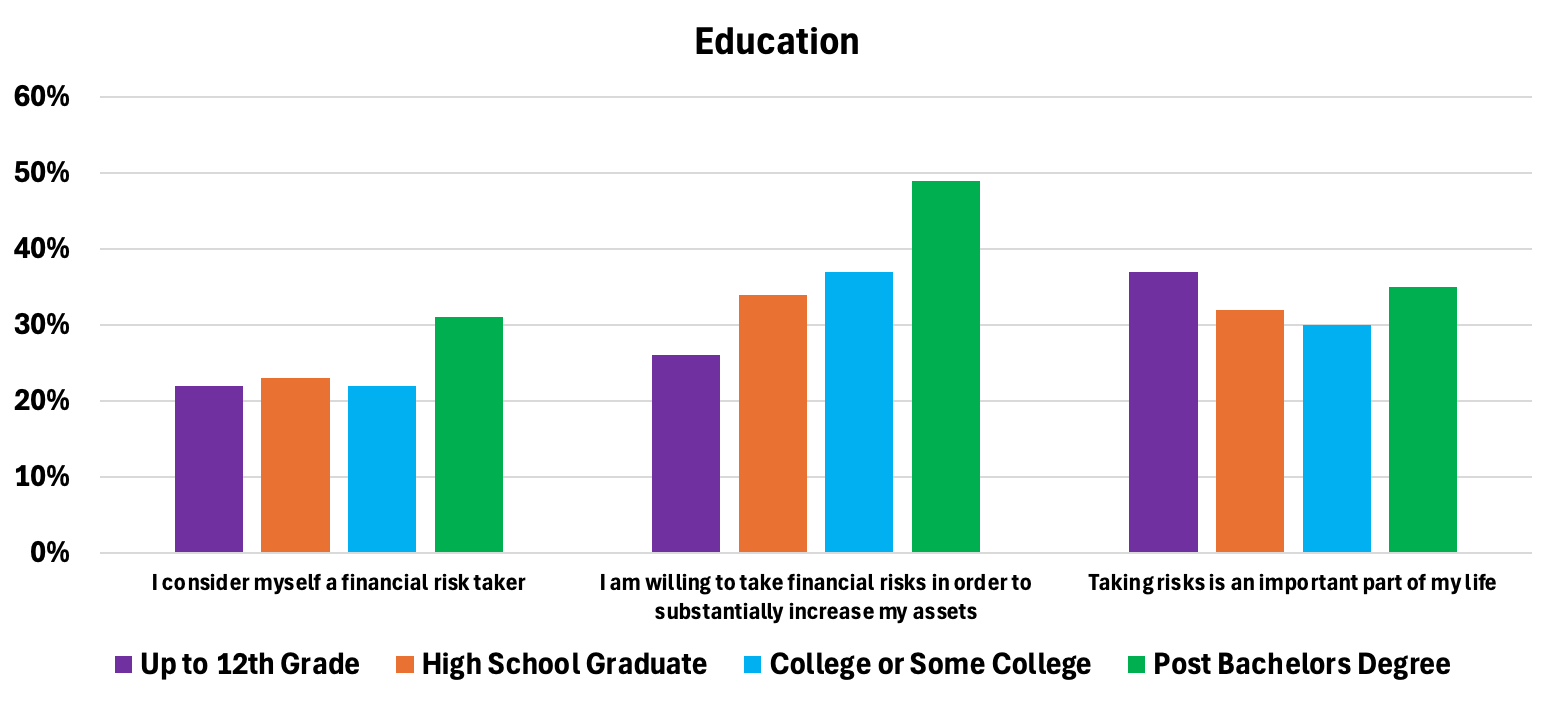
While respondents with an advanced degree are the most likely to identify as financial risk-takers, those with less than a high school diploma indicate that taking risks, in general, is an important part of their lives. High school graduates and college-educated respondents are similar in their risk tolerance.
Household Income Response to Risk Tolerance
|
|
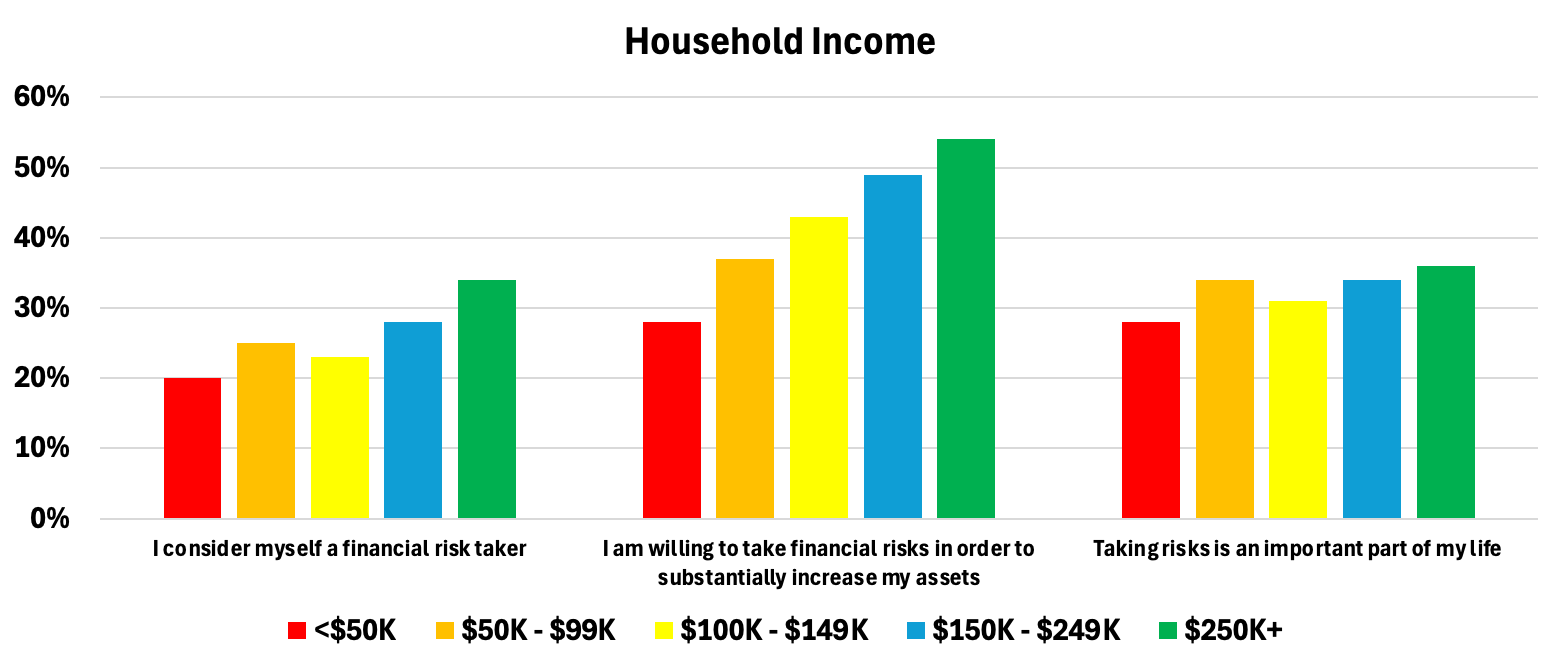
There appears to be a step-wise increase in the likelihood of taking financial risk based on increasing household income. This makes sense, since more disposable income allows for more flexibility. Interestingly, however, the $100K - $149K income range appears to be less likely to self-characterize as risk-takers relative to the next-lowest income range.
Net Asset Response to Risk Tolerance
|
|
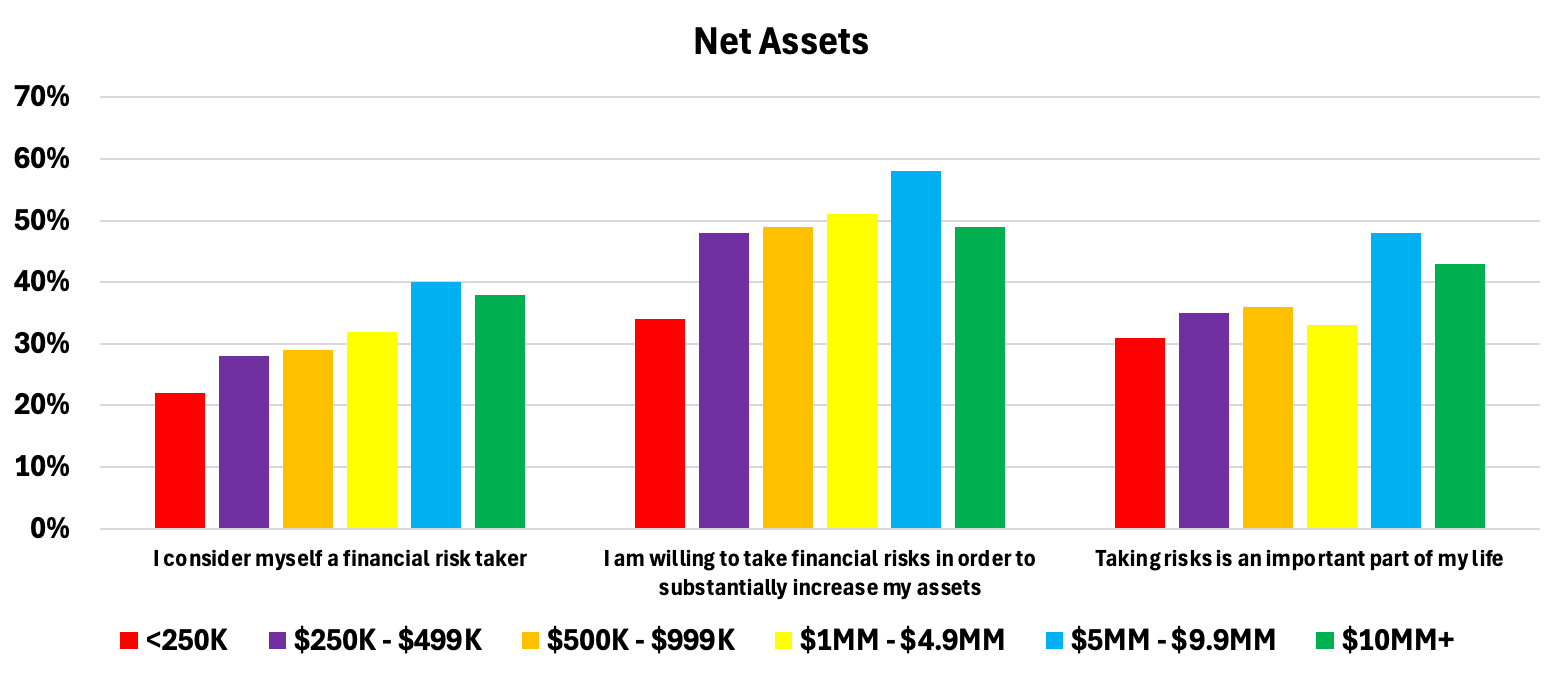
The group with net investable assets in the $5 million to $9.9 million range is the most likely to identify as risk-takers. Those with $10+ million in net assets are also more likely than those with less assets to characterize themselves as risk-takers. Unsurprisingly, the group with the least assets (<$250,000) are the least likely to take chances with their money.
Overall Findings on Risk Tolerance
It must be noted that across all of these demographic and socioeconomic segments, the majority (>50%) of respondents do not consider themselves risk-takers. Some segments have higher probabilities of taking risk, but in the absolute, demographic and socioeconomic characteristics may not be sufficient in predicting risk tolerance.
Factors Beyond Demographics & Socioeconomics
What other factors beyond demographics and socioeconomics might play into risk tolerance? A method for understanding psychological differences among a population is psychographic segmentation. Psychographics pertain to people's attitudes, values, beliefs, fears, personalities, and lifestyles, which are core to their motivations and priorities. Psychographic segmentation groups people according to these shared characteristics and helps explain WHY people do what they do.
A primary objective of Psympl's market research was to identify a psychographic model that explains consumers' financial decision-making processes and investment behaviors, essentially a client motivation analysis. Psympl identified five distinct psychographic segments for financial services:
|
|
Segment 1 (17%) I'm financially comfortable and I invest, but I'm hands-off with my investments. I want professionals to guide my investments using a safe and predictable approach. |
|
|
Segment 2 (22%) I'm financially secure and actively following the stock market and discussing finances. I favor a more aggressive approach, picking individual stocks myself and am interested in alternative investments like cryptocurrency. |
|
|
Segment 3 (20%) I'm financially secure and confident in my financial standing and retirement. I'm comfortable making my own investment decisions, and prefer a balanced approach to risk, seeking both potential gains and security |
|
|
Segment 4 (25%) I'm living paycheck to paycheck and worried about my retirement. I avoid investing and often carry credit card debt because of my financial situation. |
|
|
Segment 5 (16%) I'm pretty financially secure. I don't invest or trust the stock market but I'm still on track for retirement. My finances aren't complex, so I prefer to just manage them myself. |


Are any of these "financial personalities" more risk-tolerant than others? Looking at the attitudinal statements through a psychographic lens, it becomes clear that certain segments are willing to bear financial risk:
|
|
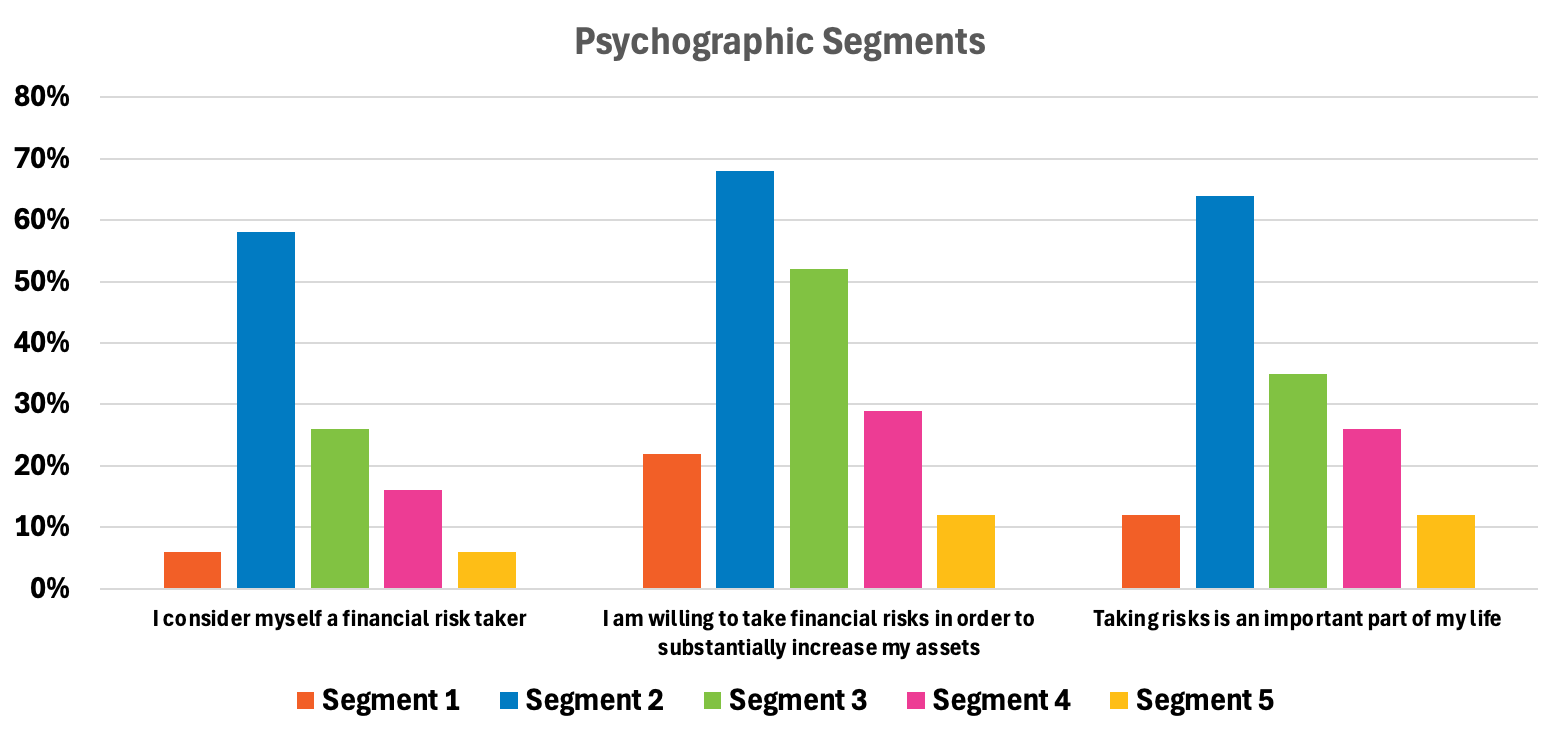
Psychographic Segment 2 is significantly more likely to describe themselves as risk-takers, financial or otherwise. Segment 3 is the second most likely to indicate they are willing to bear financial risk. Segments 1 and 5 are the least likely psychographic segments to identify with risk-taking.
Reinforcing the notion that socioeconomics may not be sufficient in predicting risk-taking attitudes and behaviors, there is little to no difference in the average household income and net investable assets among Segments 1, 2, and 3. Each of these three psychographic segments shares a similar financial status, but there is a wide variance in these segments' attitudes toward risk.
Market Conditions
All that said, these are general characterizations of each demographic, socioeconomic, and psychographic segment. The charts above illustrate how each segment thinks about themselves overall, without the context of market condition. How do situations of market under- or over-performance affect a consumer's willingness to assume financial risk? These scenarios were included in the market research.
For the following scenarios:
- Financial markets are relatively stable (no extreme upturns or downturns anticipated)
- Financial markets are growing or on a positive upturn
- Financial markets are declining or on a downturn
Survey respondents were asked,
"In each of the following scenarios, what level of financial risk are you willing to assume/take with your investments in order to possibly get greater returns/profits?"
Possible answers were:
- Extremely high risk
- Very high risk
- Somewhat high risk
- Somewhat low risk
- Very low risk
- Extremely low risk
Mean scores were calculated by assigning "Extremely high risk" a value of 6 with descending values to "Extremely low risk" a value of 1.
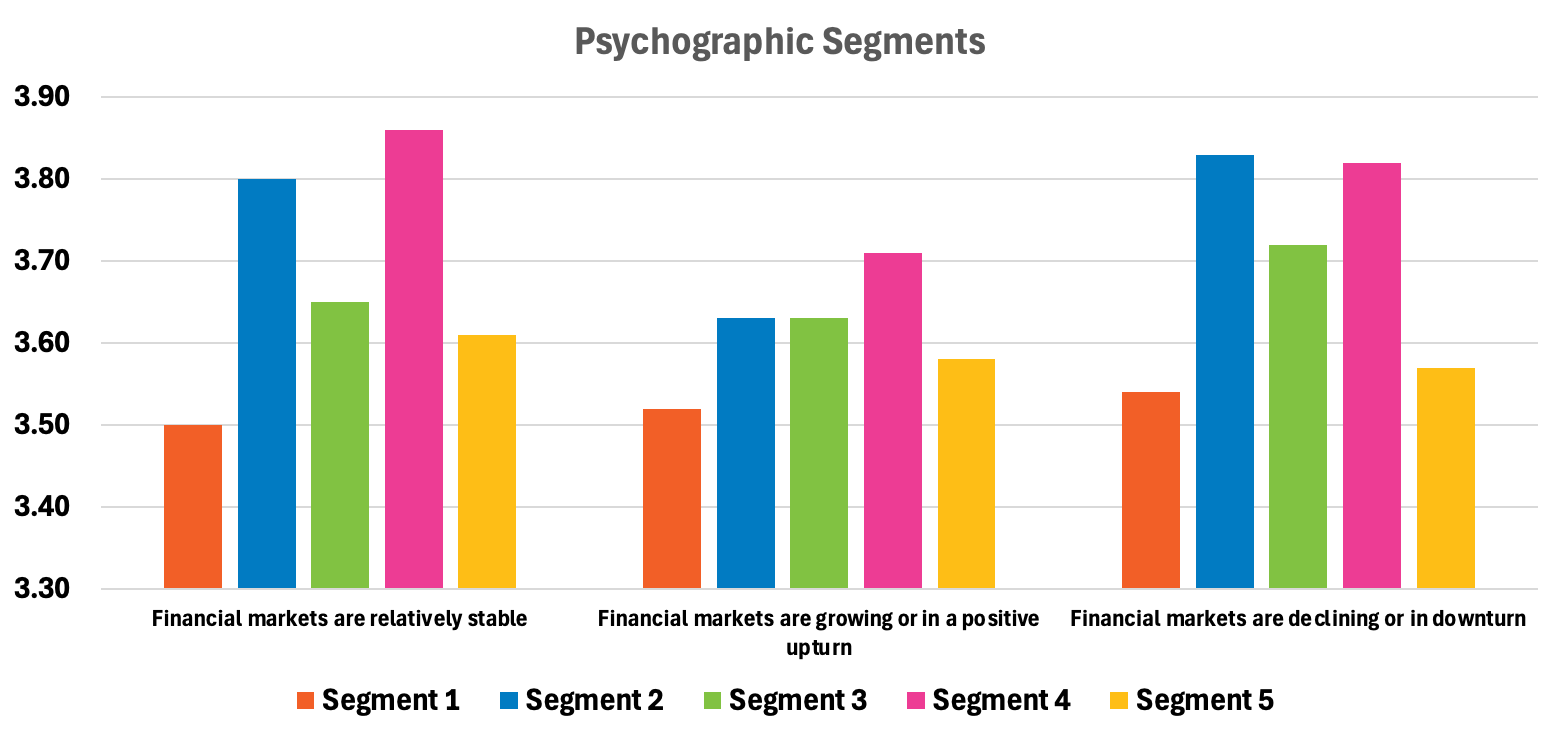
Looking at the psychographic segments, it would appear that having respondents consider the economic environments can have an impact on risk tolerance. Across all three hypothetical scenarios, Segment 4 stands out as the most likely to accept financial risk. Interestingly, Segment 4 has on average the least household income and net assets among the five psychographic segments. Segment 2 maintains a higher likelihood than other segments to assume risk across the scenarios, and Segment 1 is the least likely to tolerate risk.
|
|
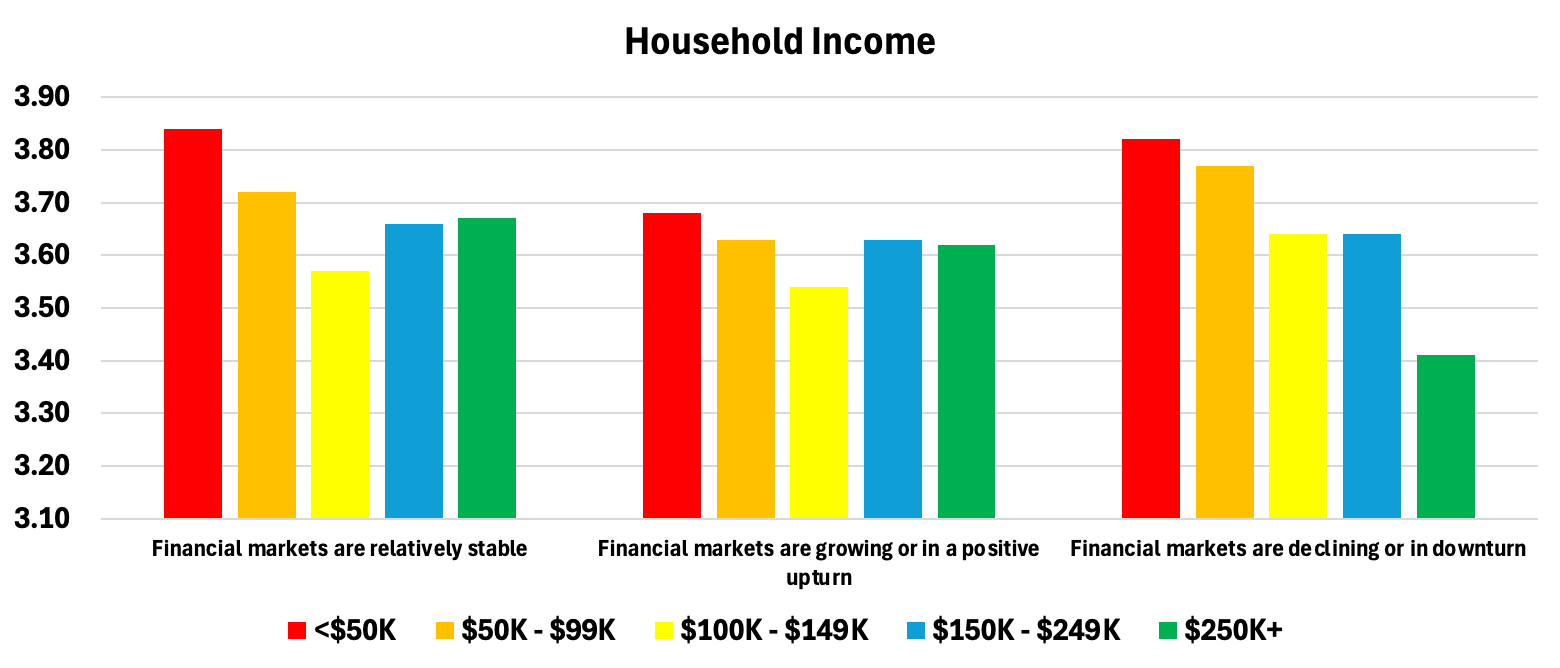
Looking at Household Income and Net Assets again, the context of market conditions appears to affect perceptions of risk tolerance. Respondents in lower average household income ranges seem to believe they can tolerate risk more than other income segments, especially in stable markets or during a downturn.
|
|
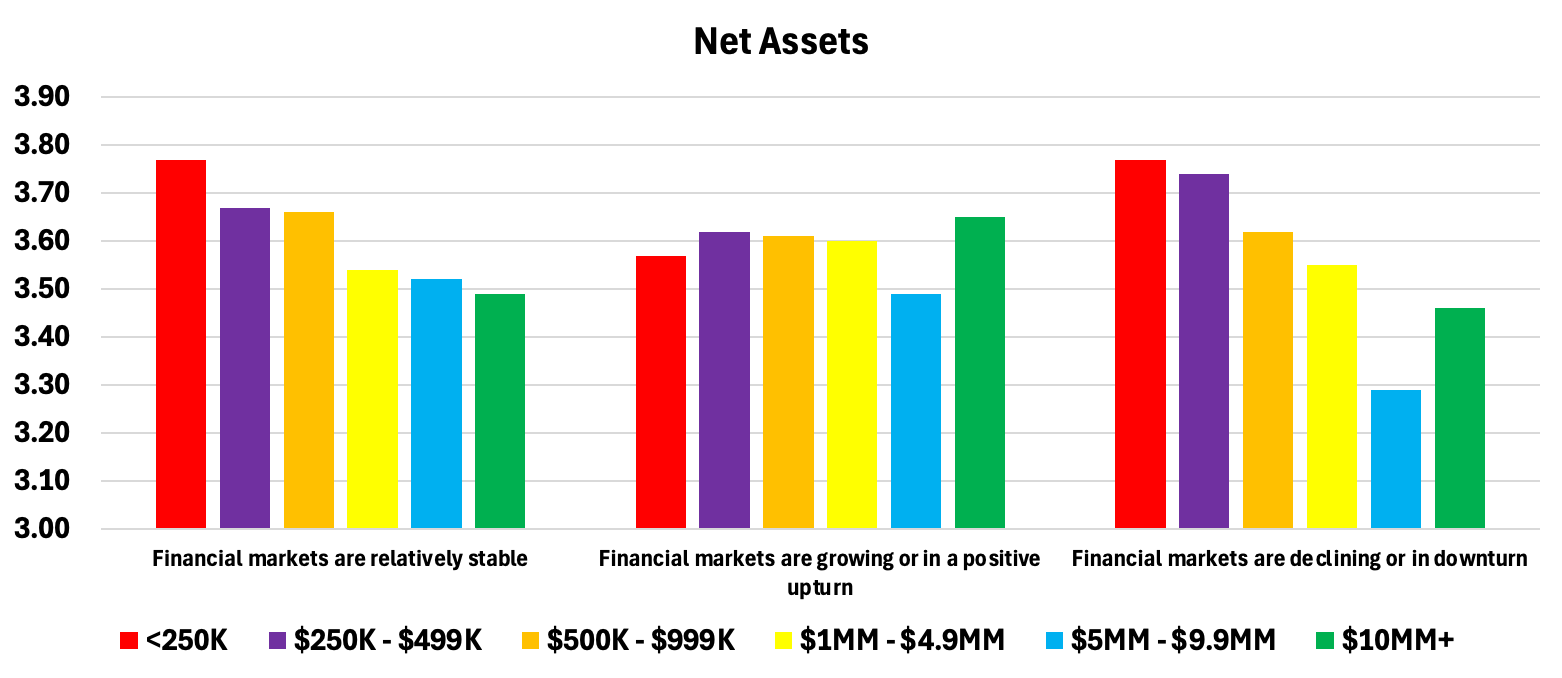
Similarly, respondents with less net investable assets also indicate a higher financial risk tolerance in stable and declining markets. In fact, the segment with the least risk tolerance is those with $5 million to $9.9 million in net assets, in apparent contradiction to the attitudinal chart earlier in this article. Again, this reinforces the notion that socioeconomic factors may not be as predictive of risk tolerance as one might assume.
|
|
By identifying a client's or prospect's psychographic profile, a financial advisor or wealth manager might better anticipate a client's/prospect's openness to risk, regardless of market conditions, and engage them according to their preferences and expectations.
Personalized Engagement
Each psychographic segment requires unique engagement strategies involving message, wording, channel mix, and frequency of communications to catch their attention and activate desired behaviors. Personalized engagement goes beyond demographic and socioeconomic variables such as age, net income, and investable assets. It takes into account psychographic, human characteristics and preferences.
Psympl offers Psychographic AITM to enable financial advisors to leverage psychographic insights and automated content generation for enhanced client engagement, prospect marketing, and wealth management personalization. Psychographic AI does not replace a financial institution's existing CRM platforms or AI tools; rather, it integrates with and enhances these technologies to maximize their effectiveness and results without disrupting current operations. Whether a financial advisor manages dozens or hundreds of clients, Psychographic AI scales to deliver advanced personalization that resonates with each, individual client.

To find out more about the Psympl's market research and Financial Segmentation Model data set, please visit our website or contact us today!

Brent Walker
Table of contents