.png?width=500&height=500&name=PSYMPL_ICON+SET-04%20(1).png)


Table of contents

.svg)
Managing a client population, nurturing productive relationships, and reinforcing client satisfaction and loyalty can be challenging for a financial advisor or wealth manager, especially when the advisor has a sizeable client base and is pursuing new prospects to grow even further. There is only so much time in a day, so financial advisors and wealth managers must prioritize which clients get more (or less) attention.
Often, this prioritization is based on the value of the client to the firm; the higher net worth or assets under management, the more attention and frequency of engagement the client gets. But is this what clients want?
Psympl's Market Research Study Findings
Psympl conducted a comprehensive market research study with Ipsos among a nationally representative sample of adults ages 18+ (n=3,000) to help answer this question. Respondents were asked:
How often do you want to meet with a professional financial advisor/wealth manager (whether in person, by phone, or videoconference)?
Respondents were offered a list of frequencies, which were assigned a numerical value (unseen by respondents) to calculate a mean value:
- Daily (30)
- Once a week (5)
- Once a month (1)
- Once a quarter (0.25)
- Twice a year (0.17)
- Once a year (0.08)
- Every two years (0.04)
- Less often than every two years (0.01)
- Never (0)
Respondents were grouped according to their net investable assets and each group's preferred mean frequency of engaging a financial advisor is shown in the graph below:
|
|
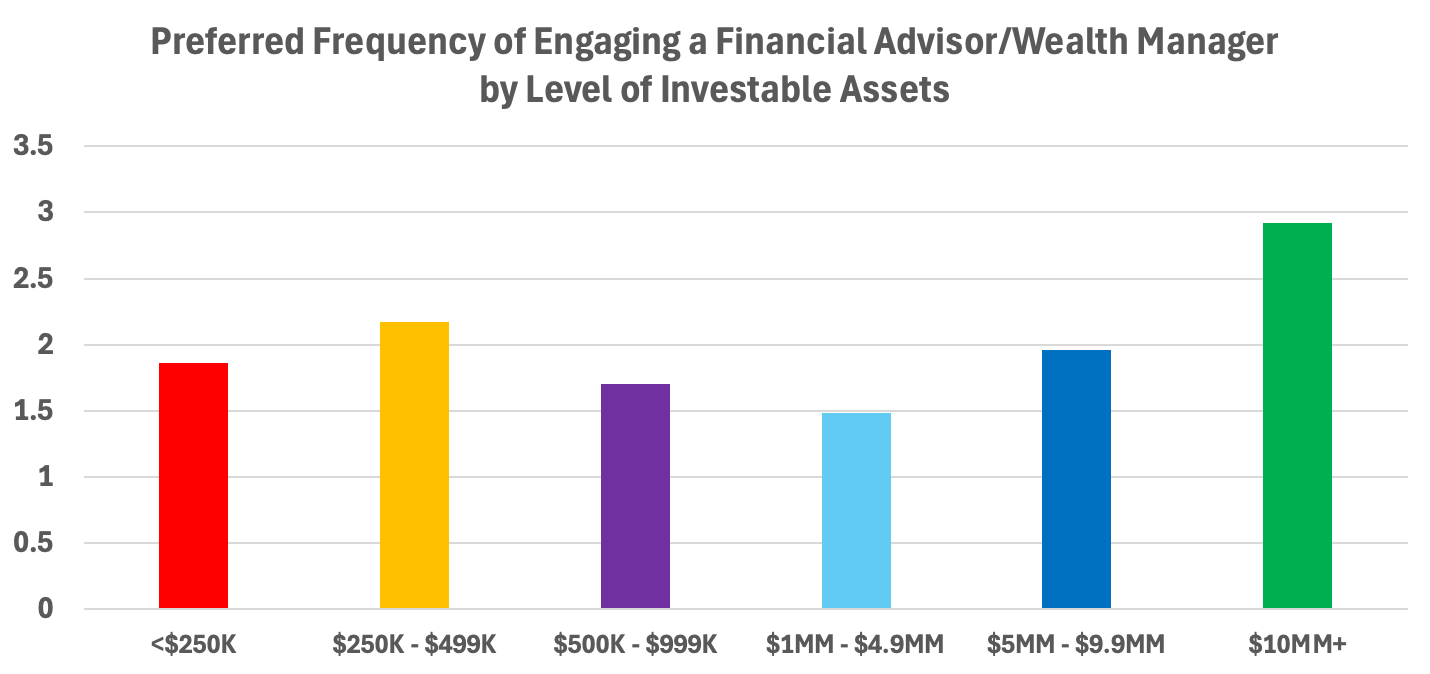
The research data indicate that, on average, the very wealthy do expect a higher level of engagement from a financial advisor, but there isn't a vast difference among other levels of assets (though people with $250K - $499K appear to desire the second highest level of engagement).
However, the story doesn't end there. The graph above shows the mean preferred level of engagement among all respondents with a level of investable assets. While certain clients may be similar according to their assets, they may have very different "financial personalities" and communication preferences. There may be clients with $5 million+ in investable assets who want to engage a financial advisor frequently, while other clients with the same level of assets may want to touch base less frequently.
Using Psychographics to Determine Engagement
How might a financial advisor anticipate the optimal level of engagement for each client? The most obvious answer is to ask them directly, but if this hasn't been done then an alternative, data-based approach is to use psychographic insights. Psychographics pertain to people's attitudes, personalities, and lifestyles, which are core to their motivations, priorities, and communication preferences.
A primary objective of Psympl's market research was to identify a psychographic model that could predict WHY people make the financial decisions and behave the way they do. Such a model would inform client and prospect engagement strategies to drive acquisition and loyalty. Psympl identified five distinct financial psychographic segments, each with a different approach to finances, investments, and working with financial advisors/wealth managers:
|
|
Segment 1 (17%) I'm financially comfortable and I invest, but I'm hands-off with my investments. I want professionals to guide my investments using a safe and predictable approach. |
|
|
Segment 2 (22%) I'm financially secure and actively following the stock market and discussing finances. I favor a more aggressive approach, picking individual stocks myself and am interested in alternative investments like cryptocurrency. |
|
|
Segment 3 (20%) I'm financially secure and confident in my financial standing and retirement. I'm comfortable making my own investment decisions, and prefer a balanced approach to risk, seeking both potential gains and security |
|
|
Segment 4 (25%) I'm living paycheck to paycheck and worried about my retirement. I avoid investing and often carry credit card debt because of my financial situation. |
|
|
Segment 5 (16%) I'm pretty financially secure. I don't invest or trust the stock market but I'm still on track for retirement. My finances aren't complex, so I prefer to just manage them myself. |


The psychographic segments have very different preferences when it comes to frequency of engagement with a financial advisor or wealth manager:
|
|
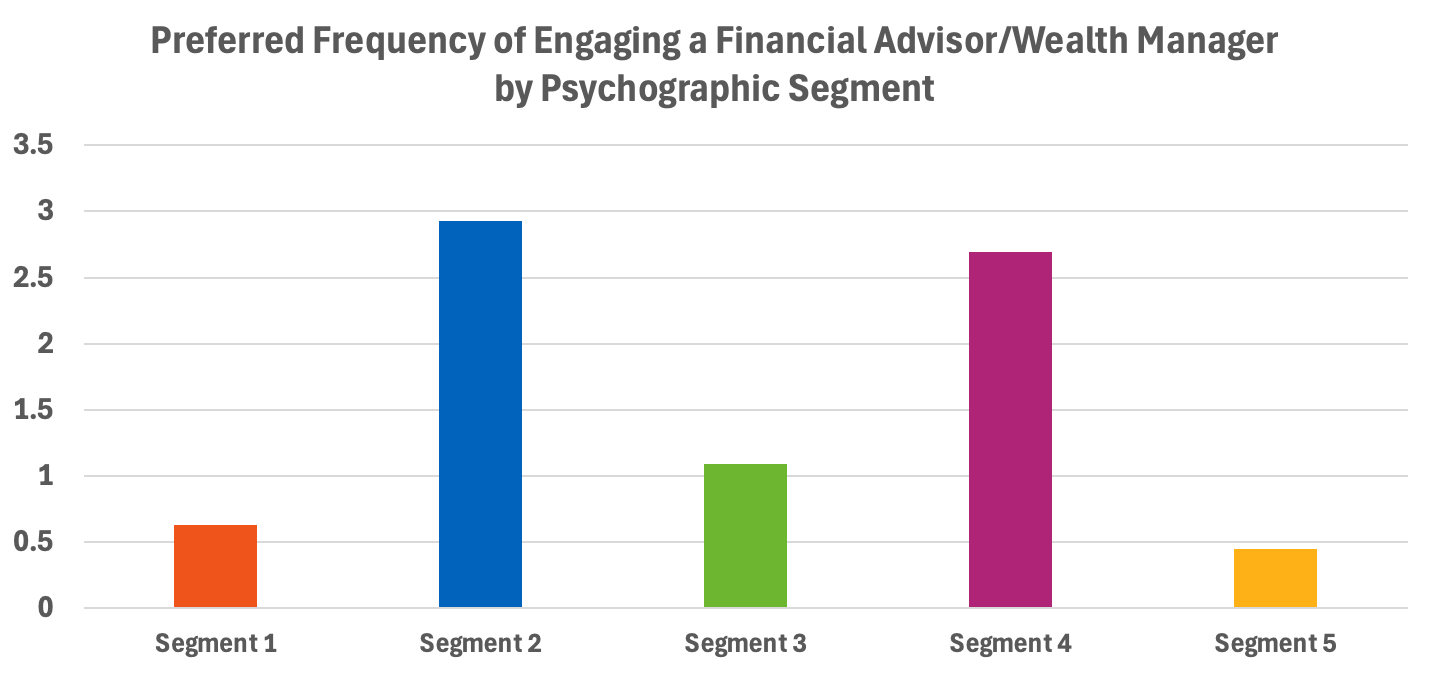
Psychographic Segments 2 & 4 desire significantly more interactions with a financial advisor, but as the segment descriptions above illustrate, these are very different "financial personalities." By the segment description alone, one might assume that Segment 4 falls lower on the asset spectrum, and this would be a correct assumption. In fact, Segment 4 has the lowest average level of investable assets among the five psychographic segments ($215K). However, there ARE members of Segment 4 with significant investments, and a financial advisor should be aware of their engagement preferences.
For perspective, the distribution of psychographic segments with $1 million to $5 million in net investable assets is as follows:
|
|
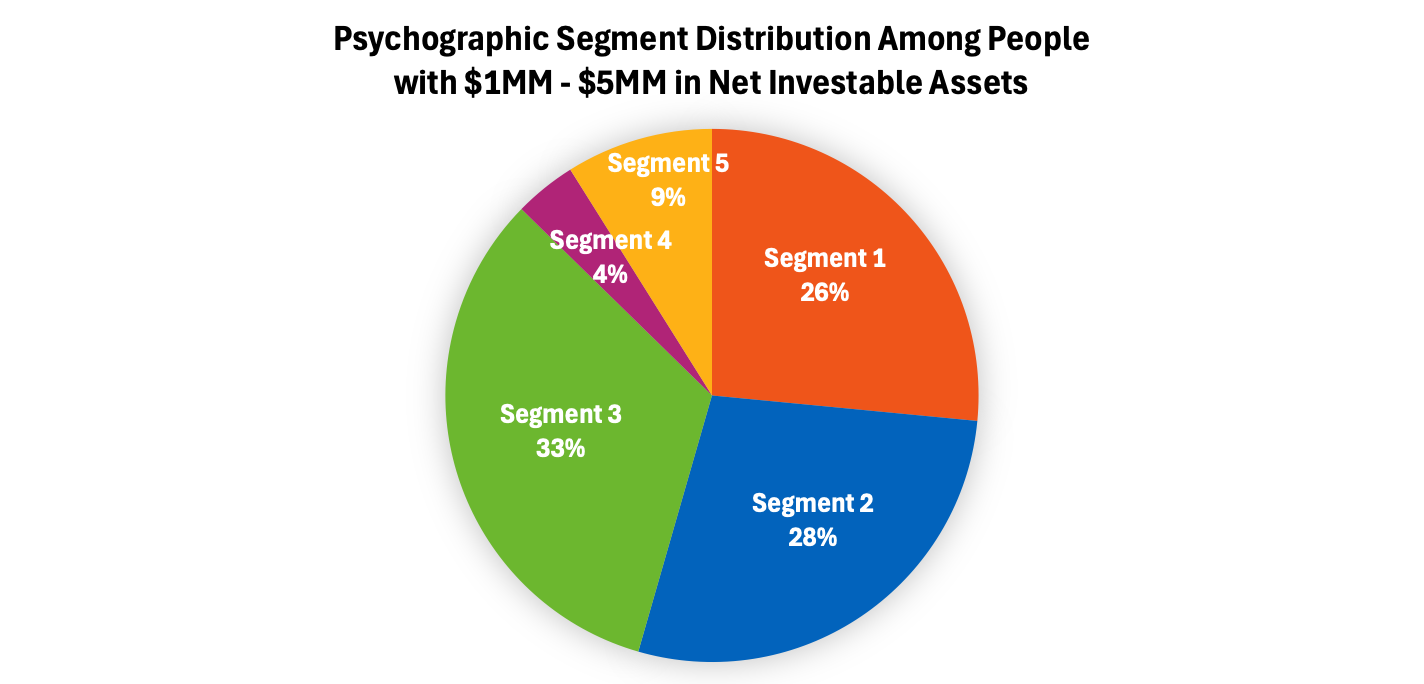
Three psychographic segments make up 87% of people with $1 million to $5 million in net investable assets and represent potential Prime Prospects for focusing resources on client acquisition and loyalty. Is there any difference in advisor engagement preferences among these three psychographic segments, even though they share similar financial standing?
|
|
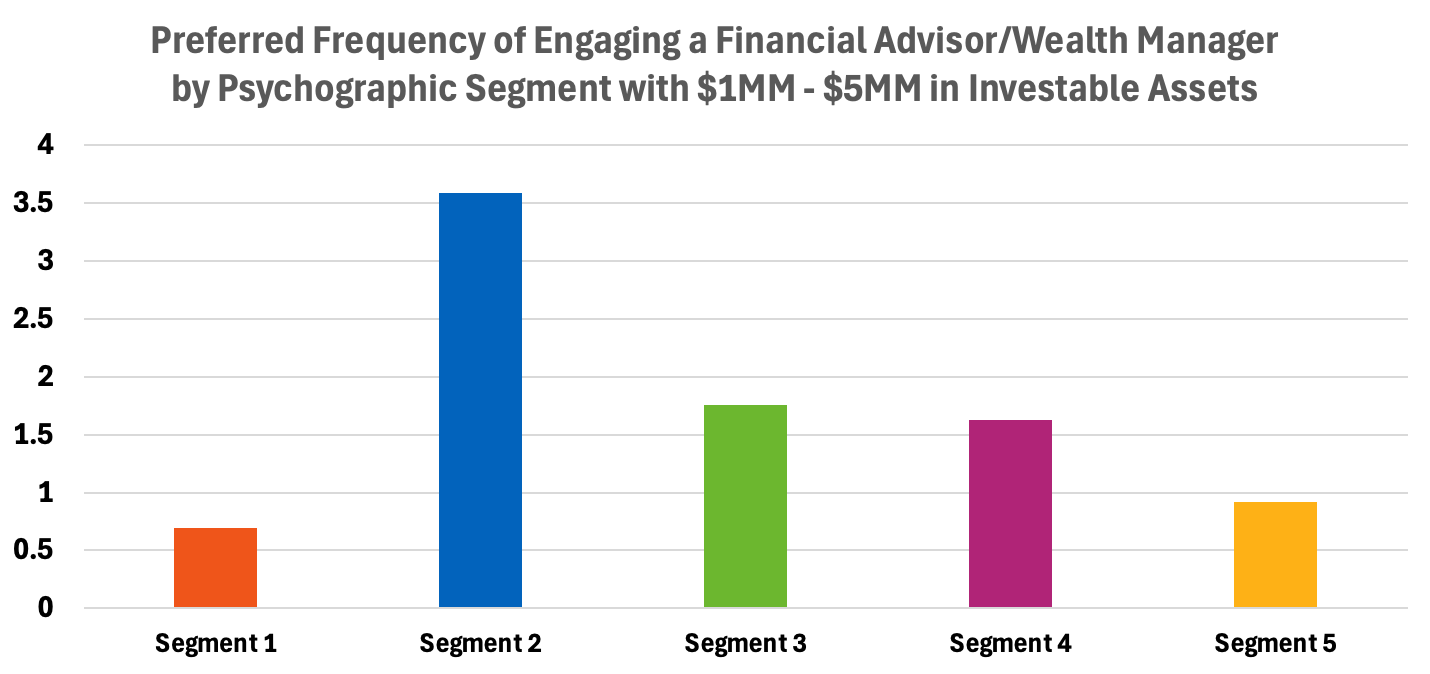
Psychographic Segment 2 desires far more interactions with a financial advisor or wealth manager than do all other segments. Note, Segment 1, which represents more than a quarter of people with $1 million to $5 million in investable assets, desires the least amount of engagement with a financial advisor. Net, just because a client has higher net worth does not necessarily mean they require a higher level of attention.
Preferred Channel of Engagement
The data shared above highlights the usefulness of psychographic insights in delivering against client expectations and facilitating satisfaction and loyalty. In addition to frequency of engagement, Psympl's market research examined preferred methods and channels of engagement. When respondents were asked:
How do you MOST prefer to meet your professional financial advisor/wealth manager?
More than half of each psychographic segment indicated that they prefer to meet in person, but the second most popular method varied by segment. Twenty-seven percent (27%) of Segment 1 prefers a phone call, while 27% of Segment 3 and 23% of Segment 2 prefer to videoconference.
Psympl's market research also examined preferences on a variety of channels across a variety of topics:
|
Topics |
Channels |
|
|
Predictably, there are differences in channel preference among the psychographic segments across the different topics; however, effective marketing and client engagement involves a mix of preferred channels, not just the reliance on a single channel, to engage clients at different touchpoints. Moreover, each psychographic segment is motivated by different things and responds to different messaging and value propositions.
Psympl's market research data can be cut by any demographic (e.g., age, gender, ethnicity, etc.) or socioeconomic (e.g., income, employment status, education, etc.) variables, too. These insights can help financial advisors and wealth managers personalize and optimize all channels of current and prospective client engagement.

For more information on Psympl's market research to enhance client engagement, please visit the Psympl website or contact us today!

Brent Walker
Table of contents